Why 95% of AI Projects Fail — Storyboarding + Causal AI Yields More Transparent AI (Part 3)

In Parts 1 and 2 of this series, we unpacked why 95% of AI projects fail and showed how combining Causal AI with the Thinking Like a Data Scientist (TLADS) methodology changes the trajectory. TLADS provides the structure to frame initiatives, harvest subject matter expertise, and map analytic insights to real decisions. Causal AI supplies the missing piece — uncovering why outcomes happen, not just predicting what might happen next.
But as organizations begin to apply these ideas, another challenge emerges: how do we make the causal logic visible, intuitive, and collaborative for everyone involved? That’s where storyboarding comes in. Borrowed from film and design, storyboarding offers a simple yet powerful way to capture the flow of decisions, interventions, and outcomes in a narrative sequence that stakeholders can easily understand.
By blending storyboarding with Causal AI, organizations can design AI applications in ways that are more relevant, accurate, and transparent.
Why Storyboarding Matters
Most AI projects stall not because the math is wrong, but because the story is missing. Business leaders, clinicians, educators, and frontline operators often struggle to understand how the AI “black box” relates to the reality they manage on a daily basis. Storyboarding closes that gap.
A storyboard breaks down an AI use case into a series of visual panels, each representing a moment in the decision-making flow. These panels align with the early steps of the TLADS methodology:
Step 1 (Assess Initiative): Define the business or operational challenge in a scene everyone recognizes.
Step 2 (Empathize with Stakeholders): Capture what matters to different participants in the narrative.
Step 3 (Model Entities): Show the people, processes, or assets at the center of the causal system.
Integrating Causal AI into the storyboard reveals the unseen: pinpointing the drivers, the interventions that alter outcomes, and the anticipated impacts. Stakeholders can visualize how cause-and-effect relationships unfold in their environment.
Causal AI + Storyboarding
Where storyboarding is paired with Causal AI, a storyboard becomes a cause-and-effect narrative that makes AI logic visible to the key stakeholders. Each panel captures not only what’s happening, but also why it matters: the drivers, the interventions, and the expected outcomes.
Let’s see a storyboard in action by modeling a hospital fall risk scenario. Falls are not only dangerous for patients but also costly for hospitals — increasing lengths of stay, driving up liability exposure, and impacting safety ratings. Traditional predictive models can flag “high-risk patients,” but they often stop short of explaining why the risk is elevated or what actions will actually make a difference.
A supporting panel might show a patient struggling to get out of bed. Causal AI surfaces the driver — nighttime sedatives. The next panel illustrates a potential intervention — adjusting medication schedules — with an expected outcome: a reduced fall risk. By chaining these panels together, the storyboard builds a clear, human-centered logic: cause → intervention → effect (Figure 1).
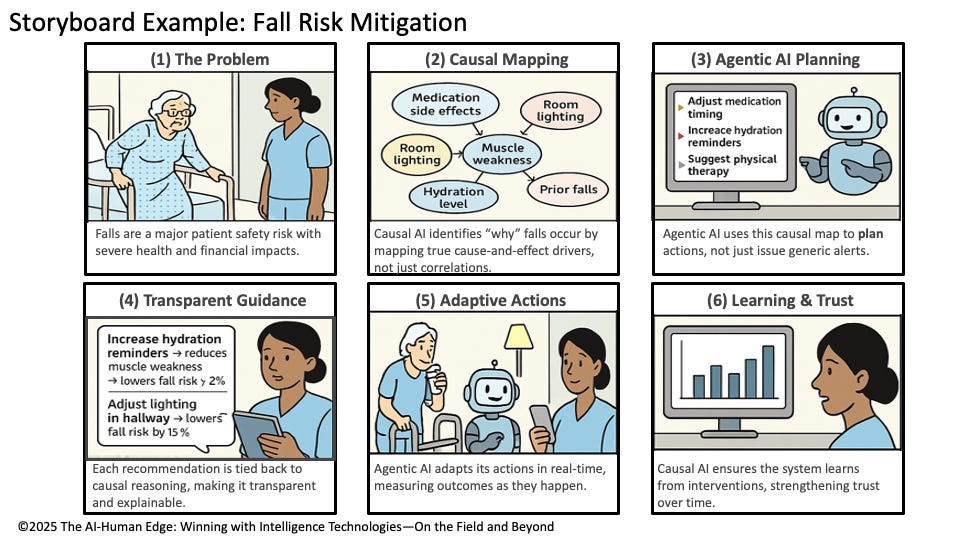
Figure 1: Storyboard Example: Hospital Fall Risk Mitigation
In practice, when an AI system (agentic or otherwise) plans actions, simulates interventions, or learns from outcomes, it’s essentially running a storyboard. The storyboard becomes both the design language and the trust bridge — ensuring stakeholders see not just what the AI recommends, but why.
Storyboard Structure
A storyboard serves as a blueprint for how an AI system should operate — whether it’s a traditional predictive model, a causal inference engine, or a fully Agentic AI application. Each panel in the storyboard maps directly to the core steps of an AI workflow (Figure 2):
Problem Context → Define the challenge in clear, real-world terms that stakeholders recognize and care about, ensuring alignment from the start.
Causal Mapping → Identify the actual cause-and-effect relationships that drive outcomes, spotlighting the levers where interventions will make the most significant difference.
Recommendations → Convert insights into clear, explainable, and actionable guidance that decision-makers can trust and easily implement.
Adaptive Actions → Illustrate how the system will adjust in real time as conditions change, turning static analysis into dynamic support.
Learning & Trust → Show how the system continuously improves through feedback while building stakeholder confidence with transparent reasoning.
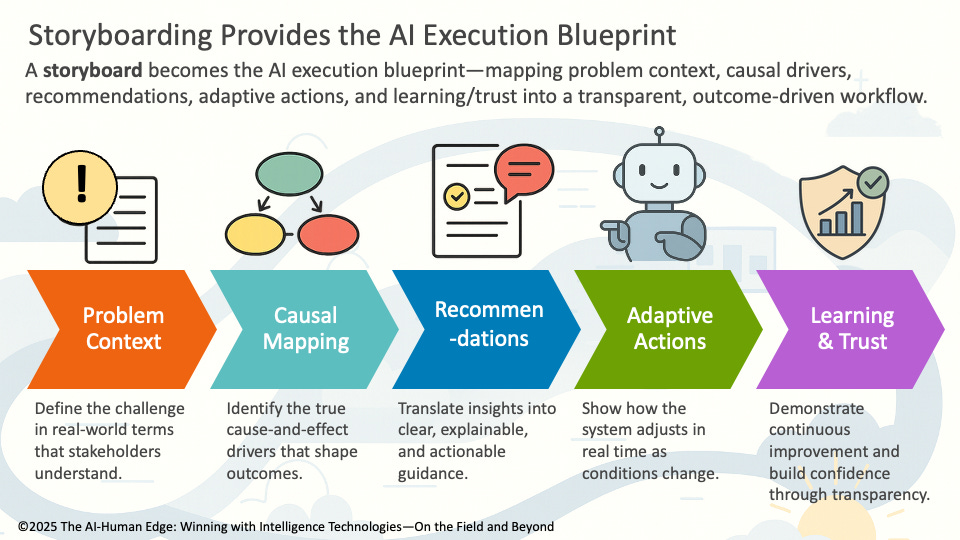
Figure 2: Storyboarding Provides the AI Execution Blueprint
The storyboard moves the conversation from concept to execution. Engineers can translate the cause-and-effect chains into Directed Acyclic Graphs (DAGs) or Structural Causal Models (SCMs). Designers can shape the user experience (UEX) so recommendations appear in natural, intuitive ways. Leaders can clearly see how every intervention ties back to the desired business or clinical outcomes.
This approach becomes especially critical in Agentic AI applications, where autonomous planning and adaptive actions can otherwise appear to be a “black box.” Storyboarding provides the missing transparency. It translates technical tools, such as Directed Acyclic Graphs (DAGs), Structural Causal Models (SCMs), and Bayesian networks, into narratives that stakeholders can follow and trust.
In this way, storyboards act as the translation layer: converting SME knowledge and causal reasoning into design-ready artifacts that engineers, analysts, and frontline operators can all understand. They keep AI projects from drifting into “math experiments” and ground them in transparent, outcome-driven narratives that everyone can understand and trust.
Storyboard Examples
Any domain where outcomes depend on complex interactions — between people, environments, and interventions — can benefit from the use of the storyboard approach. For example:
Sports: Injury prevention and performance optimization often rely on patterns that are easy to spot but hard to interpret. Storyboards help coaches and trainers visualize how causal drivers — such as fatigue, nutrition, sleep quality, and training load — interact with one another. Agentic AI can then plan adaptive interventions, such as modifying practice intensity or adjusting recovery protocols, with complete transparency about the reasoning behind these decisions.
Education: Student success depends on various factors, including attendance, mental health, and family support. A storyboard can effectively capture this causal chain, illustrating how interventions such as tutoring, schedule adjustments, or counseling impact the risk of dropout. Teachers and administrators see not just which students are “at risk,” but also why and how to help them.
Business Operations: Consider employee burnout or customer churn. A storyboard can map drivers like workload spikes, manager feedback, product usability, or service delays. AI systems then recommend targeted interventions — reallocating resources, adjusting workflows, or tailoring customer outreach — with causal reasoning made explicit.
Across all these sectors, the storyboard serves as a standard canvas where stakeholders, subject matter experts, AI designers, and end users come together. This diverse group of stakeholders views the story: here is the problem, here are the causes, here are the interventions, and here is how the system learns.
The broader implication is this: storyboards democratize causal AI. They make advanced methods accessible and actionable to non-technical stakeholders while ensuring the resulting AI systems remain grounded in real-world context, relevance, and transparency.
Part 3 Summary: Storyboarding + Causal AI: Designing More Transparent AI
Across this three-part series, we’ve been tackling one central question: Why do 95% of AI projects fail — and what can we do differently?
In Part 1, we confronted the traps: chasing technology for its own sake, relying on correlations without causation, ignoring SME knowledge, and failing to design for continuous learning. We showed how Causal AI + TLADS provide the foundation to escape those pitfalls.
In Part 2, we moved from design to build, demonstrating how causal models, algorithms, and learning constructs transform SME insights into analytic engines that are explainable, actionable, and adaptive.
And now, in Part 3, we’ve added the missing bridge: storyboarding. Storyboards transform causal reasoning into visual narratives that engage stakeholders, guide engineers, and make AI outcomes transparent and trustworthy.
Together, TLADS, Causal AI, and storyboarding form a complete playbook for AI success:
TLADS provides structure and collaboration.
Causal AI delivers the “why” behind outcomes.
Storyboarding makes it visible, relatable, and actionable.
Whether you’re building predictive models, causal systems, or Agentic AI, this trilogy underscores a simple truth: AI must be grounded in outcomes, causation, collaboration, and continuous learning if it is to succeed.