Why 95% of AI Projects Fail (Part 5): The Causal Spine — From Scores to Systems
The Causal Spine: Defined in Part 4, Executed in Part 5.


In Part 1, we started with the sobering finding from an MIT study that 95% of AI projects fail to deliver material business or operational value. We identified four recurring traps behind those failures: a technology-first mindset, correlation without causation, a lack of stakeholder collaboration, and the absence of continuous learning.
In Part 2, we demonstrated how combining Causal AI with the Thinking Like a Data Scientist (TLADS) methodology enables organizations to avoid these traps by reframing projects around high-value operational outcomes, leveraging SME expertise, and building explainable models that learn over time.
In Part 3, we introduced storyboarding — a method borrowed from film and design that makes causal logic visible and intuitive. Storyboards transform complex cause-and-effect reasoning into simple narrative panels that stakeholders can follow and trust. By pairing storyboarding with Causal AI, organizations create a bridge between subject matter expertise and technical execution, ensuring AI remains transparent, relevant, and explainable.
In Part 4, we defined the Causal Spine — starting with Structured Causal Models (SCMs), expressing them as Directed Acyclic Graphs (DAGs), and stress-testing them through Counterfactual Simulations. These steps provided clarity on why outcomes occur and what might change them.
Now, in Part 5, we execute the Causal Spine — translating those causal insights into Entity Propensity Models (EPMs) that deliver decision-ready scores, supported by Bayesian Networks that keep those scores fresh and reliable in a changing environment (Figure 1).
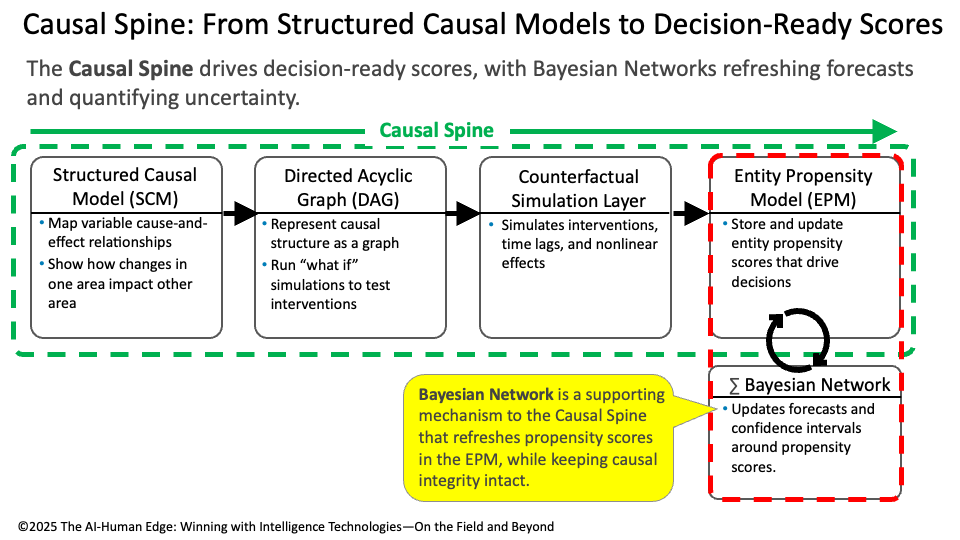
Figure 1: The Causal Spine — From Structured Causal Models to Decision-Ready Scores
Figure 1 illustrates how these components fit together into a living system. The Causal Spine ensures that AI remains explainable, adaptive, and grounded in quantifiable cause-and-effect relationships — the essential building blocks of The AI-Human Edge.
Step 4: Entity Propensity Model (EPM) — Decision-Ready Scores
The final step in the causal spine is where insight becomes action. The Entity Propensity Model (EPM) takes the results of your SCM, DAG, and Counterfactual Simulations and translates them into propensity scores — single, decision-ready numbers that reflect the likelihood of specific outcomes for individual entities (employees, patients, customers, athletes, students).
These scores serve as the operational currency of intelligence systems:
An employee’s retention risk score highlights where to focus HR interventions.
A patient’s fall risk score informs care plans and resource allocation.
A student’s learning risk score guides tutoring support and resource investment.
What makes EPMs powerful is that they are dynamic. Scores continuously update as new data flows in, ensuring that decisions remain aligned with real-world conditions rather than outdated assumptions.
Real-World Vignette: Reducing Hospital Falls
Returning to the hospital example, after testing interventions in the Counterfactual Simulation Layer, the care team receives updated Fall Risk Propensity Scores for each patient on the ward. One patient’s score may rise sharply due to a new medication, while another’s drops because family support is present during visiting hours. These patient-level scores give the team clear, individualized guidance on where to act first — making limited staff and resources far more effective.
Bayesian Network Support Mechanism — Keeping Scores Fresh and Reliable
While the causal spine (SCM → DAG → Counterfactual Simulation → EPM) provides the backbone for decision-ready scores, the Bayesian Network plays a critical supporting role. It does not replace causal reasoning but strengthens it by ensuring that propensity scores remain accurate, current, and trustworthy as conditions change.
When new information enters the system — a change in medication, a shift in staffing, or an environmental factor like reduced lighting — the Bayesian Network updates the probabilities along each causal pathway. It recalculates the conditional likelihood that one variable influences another (e.g., sedative use → cognitive status → fall risk). These updated probabilities then flow forward through the causal spine, adjusting the patient’s overall propensity score in near real time.
What makes this powerful is that the update doesn’t require rebuilding the entire causal model. Instead, the Bayesian Network uses prior probabilities (what the model already “knows”). It combines them with new evidence (fresh data) to generate a posterior probability — a refined estimate that reflects both history and the present moment. This process allows scores to continuously adapt as conditions change, without discarding the causal structure that makes them explainable.
📌 Note: Certain practitioners (hint, Mark Stouse) caution that this approach can lead to “causal washing” — updating probabilities without revalidating the structural equations that define true causality. That critique has real merit, especially in high-stakes or regulated environments. For now, it’s enough to recognize that Bayesian updating is a pragmatic mechanism to keep scores fresh in dynamic, lower-risk operational settings. We’ll explore this debate in depth in the next blog – “Part 6: Point/Counterpoint - Bayesian Network vs Directed Acyclic Graph (DAG)” – of this blog series. Dang, will this series ever end?
Bayesian updating helps in two critical ways:
Uncertainty quantification — calculating confidence intervals around causal effects, so leaders know not just what the predicted impact is, but how specific the system is about that prediction.
Forecast refresh — updating propensity scores with new data and real-world feedback, so they continuously reflect the latest environment without requiring the entire causal model to be rebuilt.
This makes the Bayesian Network the maintenance engine of the system: ensuring that decision-ready scores never go stale and that leaders can act with confidence in dynamic, uncertain contexts (Figure 2).
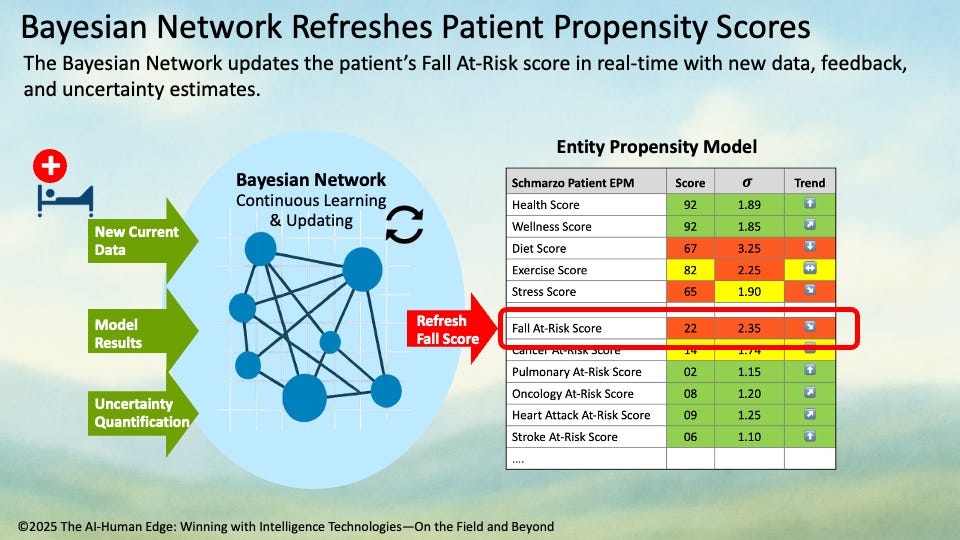
Figure 2: Bayesian Network Refreshes Patient Propensity Scores
Real-World Vignette: Reducing Hospital Falls
In the hospital setting, patient fall risk scores are recalculated daily. A Bayesian Network layer ingests new information — a change in medication, a shift in staffing levels, or a recent near-miss incident — and updates each patient’s propensity score accordingly. By quantifying uncertainty, it also flags which predictions are highly reliable versus which require closer human review, helping staff make the best use of their time and attention.
Call to Action
Your AI investments won’t reach their potential if they’re built on brittle, correlation-based foundations. That’s the trap that causes 95% of projects to fail.
In Part 1, we confronted this reality head-on, highlighting the four traps — technology-first thinking, correlation without causation, lack of stakeholder collaboration, and absence of continuous learning — that doom most initiatives from the start.
In Part 2, we showed how to escape those traps by combining Causal AI with the Thinking Like a Data Scientist (TLADS) methodology to reframe projects around high-value outcomes, harvest SME knowledge, and design explainable models.
In Part 3, we introduced storyboarding—a collaborative method that makes causal logic visible and intuitive, thereby bridging SME knowledge and technical execution.
In Part 4, we defined the Causal Spine — comprising SCMs, DAGs, and Counterfactual Simulations — providing leaders with clarity on why outcomes occur and how interventions ripple through the system.
And now, in Part 5, we’ve executed the Causal Spine — translating those insights into Entity Propensity Models (EPMs) that deliver decision-ready scores, supported by Bayesian Networks that keep those scores fresh, reliable, and adaptive.
This is how you move from fragile predictions to resilient intelligence systems. This is how you turn data into The AI-Human Edge: a system that explains its reasoning, adapts in real time, and drives measurable impact.
 | A guest post by
|