Why 95% of AI Projects Fail (Part 4): The Causal Spine-From Causal Maps to Propensity Scores
The Causal Spine: Defined in Part 4, Executed in Part 5.

In Part 1, we started with the sobering finding from an MIT study that 95% of AI projects fail to deliver material business or operational value. We identified four recurring traps behind those failures: a technology-first mindset, correlation without causation, a lack of stakeholder collaboration, and the absence of continuous learning.
In Part 2, we demonstrated how combining Causal AI with the Thinking Like a Data Scientist (TLADS) methodology enables organizations to avoid these traps by reframing projects around high-value operational outcomes, leveraging SME expertise, and building explainable models that learn over time.
In Part 3, we introduced storyboarding — a method borrowed from film and design that makes causal logic visible and intuitive. Storyboards transform complex cause-and-effect reasoning into simple narrative panels that stakeholders can follow and trust. By pairing storyboarding with Causal AI, organizations create a bridge between subject matter expertise and technical execution, ensuring AI remains transparent, relevant, and explainable.
Now, in Part 4, we define the front half of the Causal Spine — a structured flow that begins with Structured Causal Models (SCMs), expresses them as Directed Acyclic Graphs (DAGs), and stress-tests them through Counterfactual Simulations. These steps provide us with the visibility and foresight to identify which variables matter most and how interventions might ripple through the system.
In the forthcoming Part 5, we’ll execute the Causal Spine — translating those insights into Entity Propensity Models (EPMs) that deliver decision-ready scores, supported by Bayesian Networks that keep those scores fresh and reliable in a changing environment. Together, Parts 4 and 5 show how to move from causal blueprints to operational intelligence.
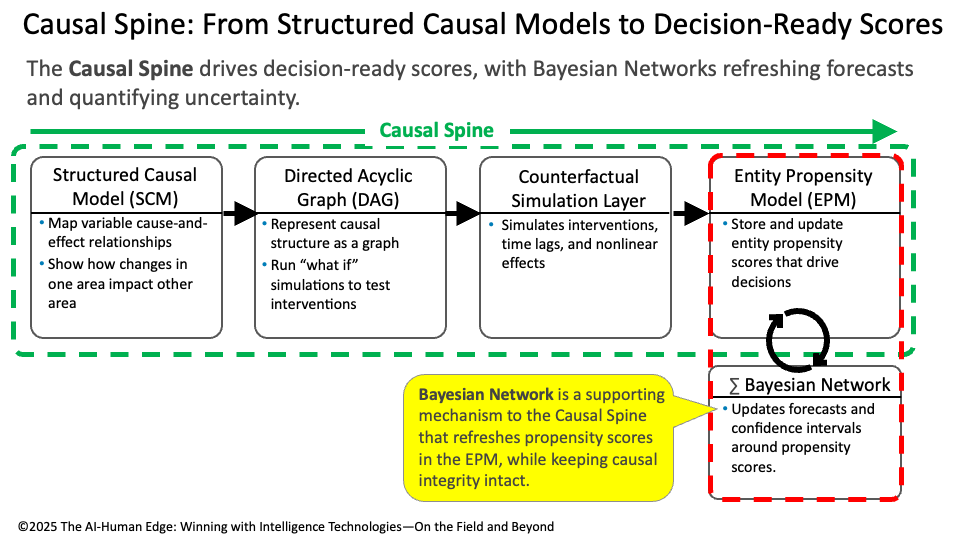
Figure 1: The Causal Spine — From Structured Causal Models to Decision-Ready Scores
Figure 1 illustrates how these components fit together into a living system. The Causal Spine ensures that AI remains explainable, adaptive, and grounded in quantifiable cause-and-effect relationships — the essential building blocks of The AI-Human Edge.
Step 1: Structured Causal Model (SCM) — The Blueprint
A Structured Causal Model (SCM) is your system’s annotated blueprint. It’s where subject matter expertise meets structured thinking to identify which variables matter most, how they influence each other, and whether those effects are positive, negative, strong, or weak.
For example, in the context of patient fall risk, an SCM highlights both direct influences (such as sedative use, mobility status, lighting conditions, and cognitive status) and indirect pathways (such as nurse-to-patient ratio affecting response time, which then impacts fall risk). These causal chains reveal the obvious drivers while also uncovering the hidden leverage points that can make interventions more effective.
The SCM is invaluable because it captures expert knowledge before diving into data. You can’t measure everything, but an SCM can ensure you’re measuring the right things (Figure 2).
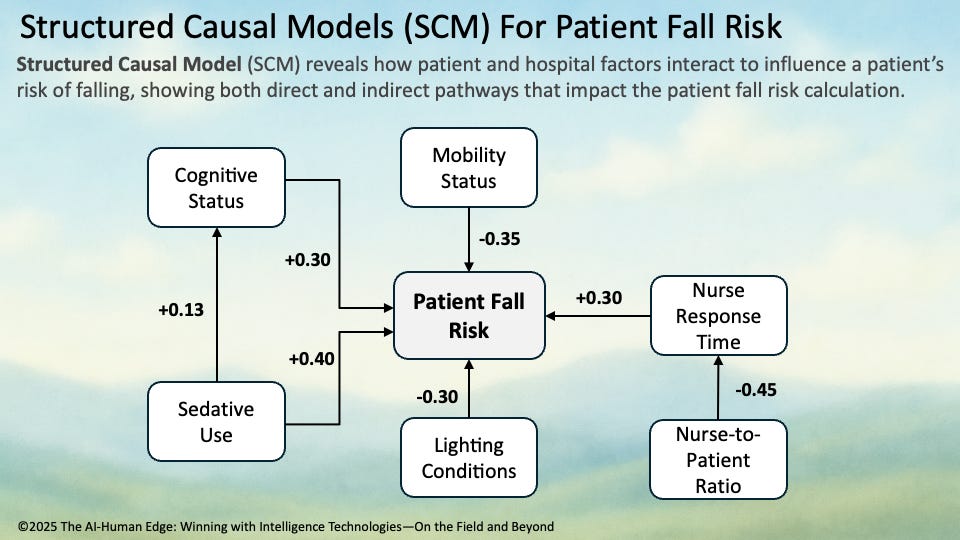
Figure 2: Patient Fall Risk SCM Diagram
Figure 2 illustrates how causal modeling applies to patient safety, showing how key factors — such as sedative use, cognitive status, lighting conditions, mobility, and nurse response time — combine to influence the likelihood of a patient fall.
Real-World Vignette: Reducing Hospital Falls
At a hospital, clinicians collaborate with data scientists to build an SCM to reduce patient falls. The model illustrates how sedative use directly increases risk, while staffing ratios shape response times that indirectly affect falls. By making these relationships explicit, the SCM helps administrators prioritize interventions that matter most — such as adjusting nighttime sedative protocols, strengthening nurse staffing ratios, or improving hallway lighting — before conducting any data science work.
Step 2: Directed Acyclic Graph (DAG) — The Proof Line
If the SCM is the blueprint, the DAG is the proof line. It takes the causal relationships captured in the SCM and expresses them as a visual graph: nodes for variables and arrows for directional influence. This structure is called acyclic because the arrows can’t loop back on themselves — the cause must always flow forward. The DAG does two essential things:
Makes causality visible — showing how factors like sedative use, mobility status, lighting conditions, and nurse response times interact.
Supports “what-if” testing — allowing teams to simulate the impact of changing one variable and see how it ripples through the system.
Unlike a correlation chart, the DAG encodes explicit cause-and-effect pathways. It serves as the governance layer of the causal spine — transparent, explainable, and ready for refinement as new knowledge comes in (Figure 3).
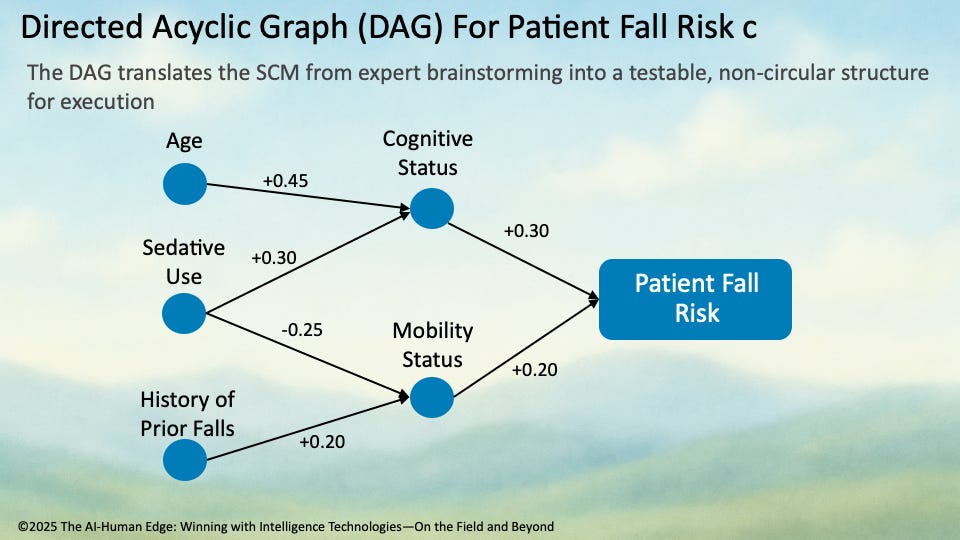
Figure 3: Direct Acyclic Graph (DAG) for Patient Fall Risk
Real-World Vignette: Reducing Hospital Falls
A hospital care team wants to understand how staffing and medication interact to drive fall risk. The DAG shows that nurse-to-patient ratios influence response times, which directly affect falls, while sedative use not only raises fall risk directly but also worsens cognitive status. Seeing these chains mapped out helps leaders grasp why interventions like adding night-shift staff or reducing sedative use can be more powerful when combined.
💡 Pro Tip: From SCM to DAG — From Brainstorm to Execution
A Structured Causal Model (SCM) and a Directed Acyclic Graph (DAG) look similar as both use nodes and arrows to map cause-and-effect. But their purpose is very different:
SCM = Brainstorming Blueprint
The SCM is a collaborative tool for capturing SME domain knowledge. It surfaces both direct and indirect causal factors, even if they overlap or form circular loops. The goal is to explore everything that might matter.DAG = Execution Blueprint
A cleaned-up, testable version of the SCM. It strips out circular references and redundancies, ensuring that causality always flows forward and that the model can be coded and validated by data scientists.
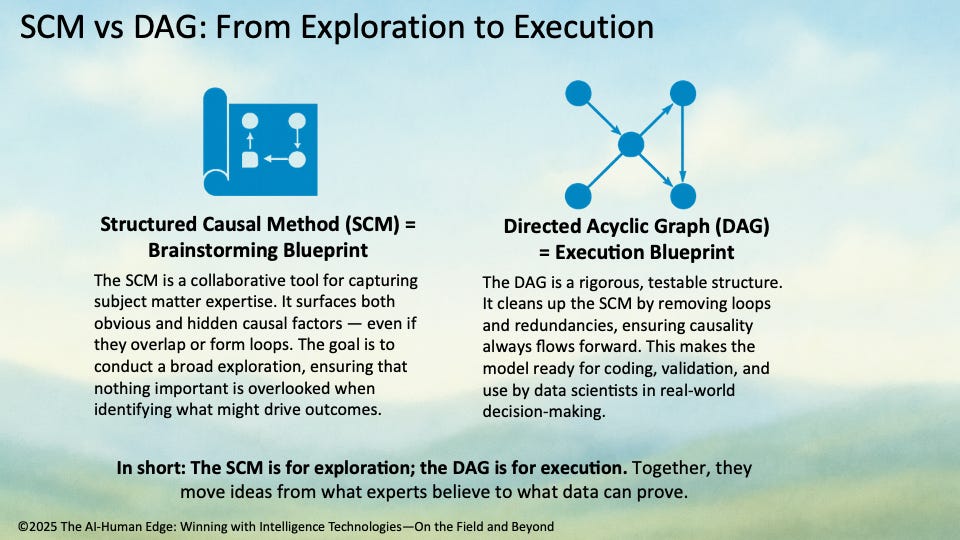
Figure 4: Structured Causal Model (SCM) vs Directed Acyclic Graph (DAG): What’s the Difference?
In short: The SCM is for exploration; the DAG is for execution. Together, they move ideas from what experts believe to what data can prove.
Step 3: Counterfactual Simulation Layer — Testing “What If” Scenarios
If the DAG makes causal relationships visible, the Counterfactual Simulation Layer makes them actionable. This step allows us to test interventions, account for time lags, and explore nonlinear effects that occur in real-world systems.
Counterfactual simulations ask the questions leaders actually care about:
What happens to retention risk if we improve mentorship availability by 20%?
How would patient fall probability change if we reduce sedative use during overnight shifts?
What if training access is expanded, but workload balance worsens?
By running these “what if” scenarios, the Counterfactual Simulation Layer identifies which levers matter most — and how combinations of changes ripple through the system. It moves causal modeling beyond diagnosis to prescription, giving decision-makers confidence in choosing the right interventions before deploying them in the real world.
The Counterfactual Simulation Layer turns causal models into a safe testing ground, where leaders can experiment virtually with interventions, anticipate ripple effects, and act with greater confidence in the real world (Figure 5).
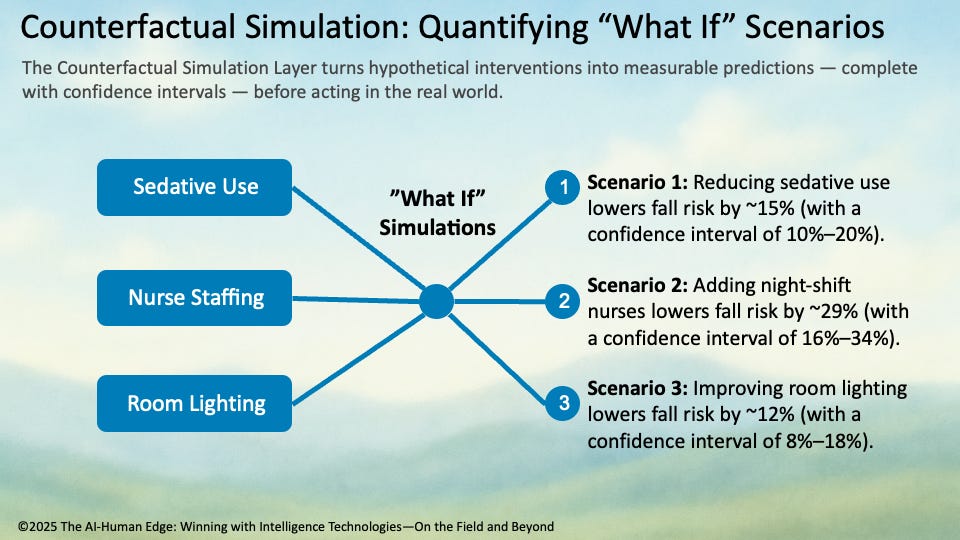
Figure 5: Quantifying “What If” Scenarios
📘 Sidebar: How Counterfactuals Become Practical
Counterfactual simulations are comprised of powerful algorithms and techniques, including:
Structural Equation Models (SEMs): Provide the mathematical scaffolding to encode cause-and-effect relationships.
Do-Calculus (Judea Pearl): Supplies the rules for adjusting variables and testing interventions without introducing bias.
Monte Carlo Simulations: Run thousands of randomized trials to estimate outcomes and generate confidence intervals.
Real-World Vignette: Reducing Hospital Falls
A hospital care team wants to know whether hiring two additional night-shift nurses or reducing sedative use will have a greater impact on lowering patient fall risk. The Counterfactual Simulation Layer can model both interventions — individually and in combination — showing not only which strategy works best, but also how the timing and interaction of those changes affect overall outcomes.
Summary: Causal Spine Defined
We’ve now built the front half of the Causal Spine — from blueprinting with SCMs, to validating pathways with DAGs, to stress-testing interventions with counterfactual simulations. Together, these steps give us clarity on why outcomes occur and what might change them.
But clarity alone doesn’t drive action. To guide real-time decisions, we must operationalize these insights into scores that adapt as conditions shift. That’s where Entity Propensity Models (EPMs) and Bayesian Networks come in.
👉 Stay tuned for Part 5: The Causal Spine — From Scores to Systems, where we’ll show how to turn causal intelligence into living, learning assets that deliver measurable impact.
Most AI systems generate propensity scores as static outputs — predictions frozen in time, modeled from historical data, and increasingly misaligned with today’s realities. When the world shifts, these scores drift, degrade, and deceive. In response, many platforms rely on Bayesian updating to refresh their outputs, applying statistical smoothing to mask growing uncertainty.
Proof Causal AI takes a fundamentally different path.
At Proof, propensity scores are not endpoints. They are live signals within a closed-loop causal system — always grounded in structural logic, always responsive to the real world, and always auditable. These scores update not by recalculating probability, but by revalidating causality.
In this architecture, the Directed Acyclic Graph (DAG) serves as your GPS: a real-time, continuously updating causal map that guides action and recalibrates when the landscape changes.
No Bayesian Shortcuts
Bayesian Networks have become a common fallback for AI systems struggling to stay relevant. But they represent a regression — a retreat from causality into correlation-in-a-costume. These networks update output probabilities based on observed frequencies, but they do not challenge or retest the causal architecture itself.
Bayesian updates keep the math moving — but often leave the model unexamined.
The result is a dangerous illusion of confidence. Scores get refreshed, but the causal backbone stays frozen — brittle, biased, and increasingly untethered from reality. Proof rejects this shortcut. Causal integrity matters more than probabilistic convenience.
The Causal Feedback Loop: How Proof Keeps Scores Grounded
Here’s how Proof’s causal refresh cycle works — without drifting into Bayesian territory:
1. Causal Mapping
Start with a Structured Causal Model (SCM), built with subject matter expertise. This becomes the DAG — the operational backbone of the system.
2. Simulation and Scoring
Use the DAG to simulate interventions, account for time lags, and generate decision-ready propensity scores for every entity — a customer, patient, sales rep, or channel.
3. Action and Observation
Decisions are made based on those scores. Interventions are deployed. Behaviors shift. External conditions evolve.
4. Revalidation, Not Reweighting
Instead of smoothing predictions through Bayesian math, Proof revalidates the causal pathways themselves:
o Are the relationships still active?
o Have effect sizes changed?
o Are time lags shifting?
o Are new confounders emerging?
5. Score Refresh
Only once the DAG remains valid under the new conditions does Proof re-issue updated scores — grounded in tested causality, not guesswork.
This is not a statistical filter. It’s a causal feedback engine.
Why This Matters: From Prediction to Prescription
Causal Propensity Scores don’t just say what might happen. They reveal:
• Why it might happen
• When it’s likely to happen
• What levers you can pull to change the outcome
In Proof, this plays out across a wide variety of enterprise use cases:
• Sales & GTM: Which marketing campaigns actually increase conversion, accounting for lag and external noise?
• Customer Success: Which retention strategies have true downstream impact — and on which cohorts?
• Healthcare: Which interventions lower patient risk — and which are mere statistical artifacts?
And because every score comes from a transparent causal model, decision-makers can:
• Audit the logic
• Simulate alternatives
• Defend the rationale
Propensity at Human Speed — But With Causal Truth
Real time data is meant only for machines. When humans are faced with it, they downshift in order to try to get context, and that obviates the value of real-time decisions. The idea of relevant time, defined by the cadence and speed of human decision-making, is far more important.
Put another way, in a volatile world, it’s not enough to update faster. You have to update correctly and decide correctly.
That means:
• Reassessing assumptions
• Retesting interventions
• Reaffirming cause-and-effect
Proof Causal AI delivers propensity at the speed of causal reality — not statistical decay. No Bayesian patchwork. No black-box drift. Just a continuously learning, rigorously validated causal engine that keeps your decisions aligned with how the world actually works.
📍 Causality doesn’t change because the math gets fuzzy. And your AI shouldn’t either.