Why 95% of AI Projects Fail — and How Causal AI + TLADS Can Change the Game (Part 2)
Part 2: From Framing to Building – Making Causal AI Real

In Part 1, we established the foundation for success. By framing the initiative around business outcomes, harvesting stakeholder expertise, modeling the patient as the central entity, and prioritizing the most valuable use cases, we aligned our work with what truly matters: reducing patient falls in ways that are explainable, actionable, and trusted.
Now, in Part 2, we move from design to build. This is where the causal AI model development process begins in earnest. We’ll brainstorm potential features and signals, structure them using causal modeling tools, and then apply analytical algorithms that can quantify not just who is at risk but also why — and what interventions will make the most significant difference.
Through Steps 5–8 of TLADS, we’ll show how the Fall Risk Score evolves from a set of stakeholder insights into a living decision engine. Along the way, we’ll see how this process directly avoids the failure traps that derail so many AI initiatives by moving beyond prediction into continuous learning and adaptive decision support.
Let’s dive into Step 5: Brainstorming Scores and Features.
TLADS Step 5: Brainstorm Scores & Features – Mining Tribal Knowledge
Step 5 is where Causal AI model development kicks into gear. In Step 4, we identified a high-value use case: “Improve Fall Risk Identification and Interventions Effectiveness”. This use case requires the creation of a Daily Fall Risk propensity score.
In Step 5, we focus on brainstorming the variables and features that could power our Fall Risk Score. This stage is deliberately expansive, to capture a wide range of potential features that reflect the patient’s condition, context, and environment.
Some features are clinical: gait stability during physical therapy, use of sedatives, cognitive impairment scores, or a history of prior falls. Others are contextual, such as nurse-to-patient ratios, time of day, shift handoffs, or the distance of a patient’s room from the nursing station. Still others are environmental, such as floor conditions, nighttime lighting, or whether bed alarms are in use.
This process is about surfacing tacit expertise. Nurses may be aware that certain medications can increase impulsivity after a specific time. Administrators may understand how staffing dips during shift changes increase risk. Families may share observations about how a patient behaves at night versus during the day. This is where causal modeling techniques come in (Figure 1):
Directed Acyclic Graphs (DAGs): Serve as the whiteboard of causal thinking. They sketch cause-and-effect relationships between features such as medications, staffing levels, and environmental factors.
Bayesian Networks: Take the DAG a step further by layering in probabilities. For example, “sedatives increase fall risk by 30% under current staffing ratios.” This allows the model to reason under uncertainty.
Structural Causal Models (SCMs): Function as the “what-if engine.” SCMs allow us to run interventions with do() logic, such as “What happens to fall risk if we increase nighttime nurse rounds?” or “What if we reduce sedative use?”
Causal Forests and Uplift Models: Extend tree-based methods to estimate heterogeneous treatment effects, showing which patients are most (or least) likely to benefit from specific interventions.
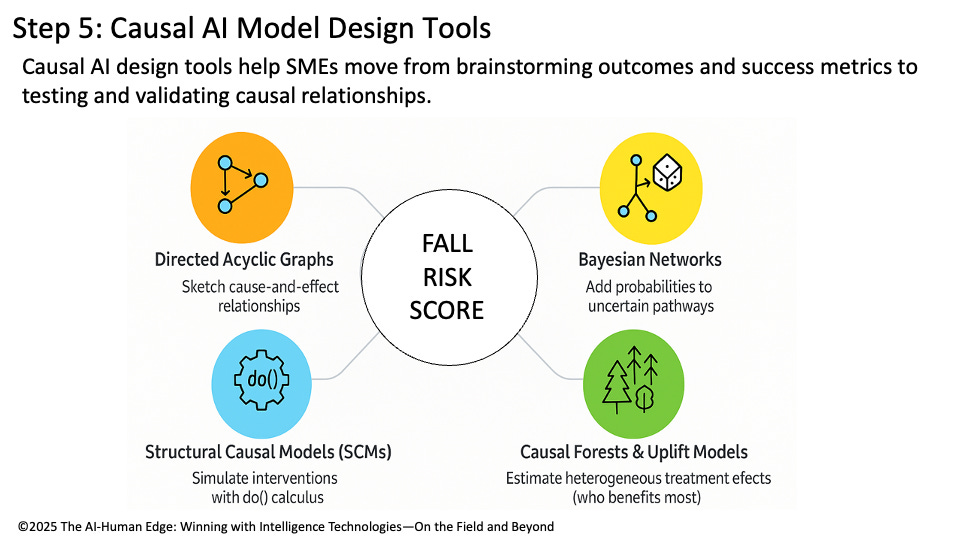
Figure 1: Step 5: Causal Analytics Model Design Tools
💡 Causal AI Lens – TLADS Step 5
Causal AI design tools transform brainstorming into a map of relationships that shows how variables interact to achieve our desired outcomes. Directed Acyclic Graphs (DAGs), Bayesian Networks, Structural Causal Models (SCMs), and Causal Forests transform SME input into structured, testable hypotheses that provide the foundation for building, testing, and refining our Fall Risk Score.
TLADS Step 6: Explore Analytic Algorithms – The Right Tools for Causal Insight
With features and relationships defined, Step 6 marks the transition from design to computation. This is where we select the causal algorithms that will transform SME insights and modeled features into a functioning Fall Risk Score, one that is not only predictive but also explainable and actionable. Unlike traditional machine learning approaches that rely on correlation (such as logistic regression, gradient boosting, and random forests), causal algorithms are designed to uncover cause-and-effect relationships and simulate what-if interventions. Here are the most relevant causal AI algorithms for developing a Fall Risk Score:
Propensity Score Matching (PSM):
Balances treatment and control groups (e.g., patients on sedatives vs. those not) to estimate treatment effects while reducing bias. Helpful in quantifying how much specific interventions (like reducing sedatives) contribute to fall risk.Causal Forests / Uplift Modeling:
Tree-based methods that estimate heterogeneous treatment effects — in other words, which patients are most (or least) likely to benefit from interventions. This is critical for precision fall prevention, since not every patient responds the same way to staffing changes or medication adjustments.Instrumental Variables (IV):
Helps isolate causal effects when confounding is strong. For example, staffing ratios may be influenced by many other variables; IV methods can disentangle staffing impact from correlated noise.DoWhy / EconML (Causal Machine Learning Frameworks):
Modern causal AI libraries that integrate DAG-based design with algorithmic engines. These frameworks enable the testing of multiple methods (PSM, causal forests, double machine learning) to ensure the robustness of the Fall Risk Score.Double Machine Learning (DML):
A hybrid approach that leverages machine learning for feature selection while maintaining unbiased estimates of causal effects. DML is especially useful in complex hospital settings with high-dimensional data.
Together, these algorithms move us toward building a propensity score that can indicate why risk is high, which interventions are most effective, and which patients will benefit the most from those interventions (Figure 2).
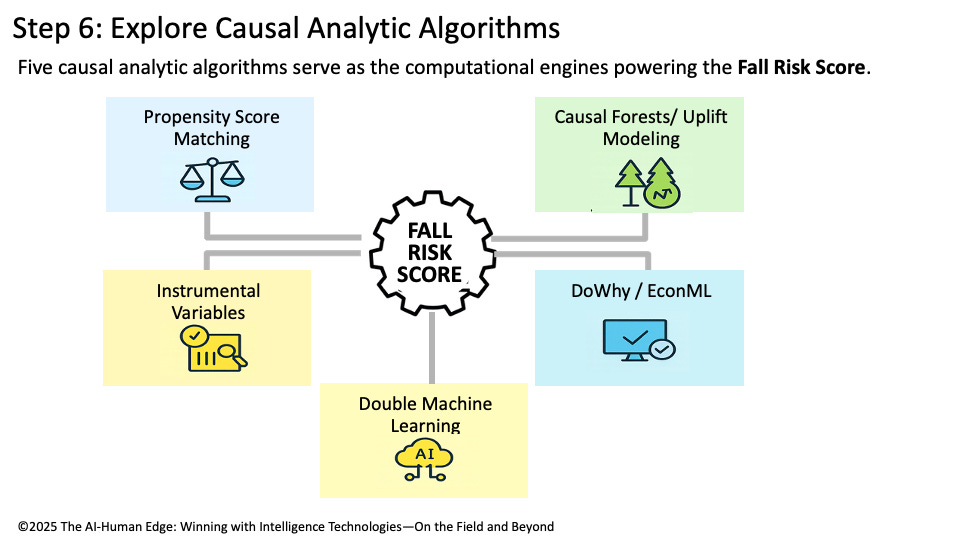
Figure 2: Step 6: Explore Causal Analytic Algorithms
💡 Causal AI Lens – TLADS Step 6
Causal analytic algorithms power the Fall Risk Score’s engine. PSM ensures fair comparisons, causal forests personalize interventions, IV disentangles complex variables, and frameworks like DoWhy/EconML bring it all together into scalable, testable models. This step transforms causal design into computational power, enabling hospitals to move confidently from SME insights to actionable, evidence-based interventions.
Step 7: Map Scores to Decisions – Turning Analytics into Trusted Guidance
The real power of a Fall Risk Score lies in its ability to drive better, faster, and more consistent decisions. Step 7 ensures that the analytic outputs created in earlier steps are explicitly mapped to frontline actions, policies, and workflows. In practice, this means designing the Fall Risk Score so it translates into specific, actionable recommendations:
Staffing Decisions: Assign a sitter for high-risk patients, adjust rounding frequency during night shifts, or Reallocate staff coverage during shift changes.
Clinical Decisions: Review and adjust sedative medication orders, flag patients for physical therapy or mobility support, or schedule additional cognitive or balance assessments.
Environmental Decisions: Reposition the patient’s bed closer to the nurses’ station, ensure well-lit, clutter-free rooms, or deploy bed alarms or fall-prevention mats.
These are direct interventions that frontline caregivers, charge nurses, and administrators can implement in real time. The tighter the mapping from score to action, the greater the clinical, operational, and financial impact (Figure 3).
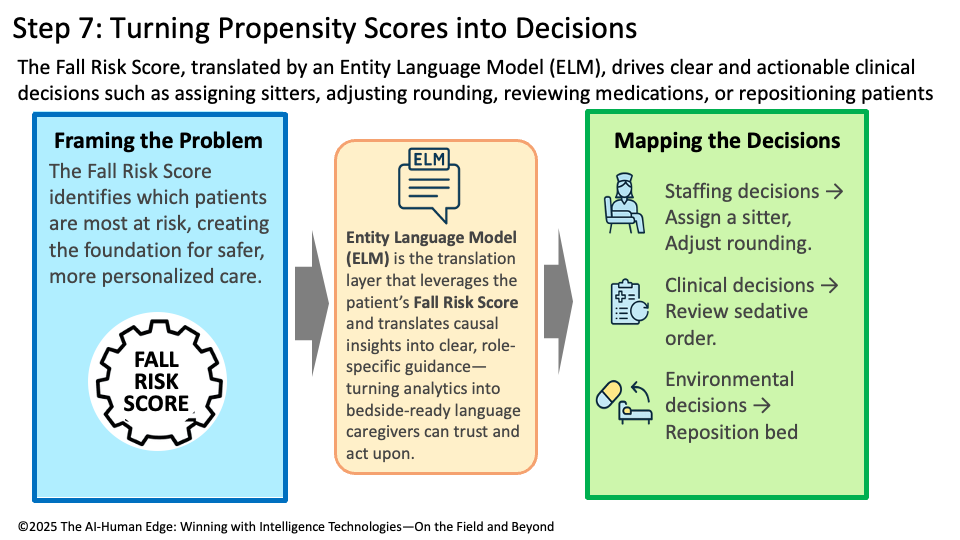
Figure 3: Step 7: Turning Propensity Scores into More-informed Decisions
💡 Causal AI Lens – TLADS Step 7
Causal AI ensures that every decision derived from the Fall Risk Score is grounded in understanding why the patient is at elevated risk and which interventions have the most significant impact. Unlike predictive-only models that flag “high risk” without explanation, causal methods surface the drivers (e.g., sedatives, nighttime staffing, mobility issues) that justify each recommendation. This is where Entity Language Models (ELMs) excel: they convert causal reasoning into natural, bedside language tailored to the audience — nurses receive clear instructions, administrators see policy-level impacts, and physicians receive clinical rationale.
Step 8: Create Learning-Based User Experience — Enter Bayesian Updating
The final step ensures that the Fall Risk Score doesn’t become just another static model. Instead, it becomes a living, learning system that adapts based on outcomes and new evidence. This is where Bayesian Updating enters the picture.
Bayesian Updating: A statistical learning method that revises probabilities or beliefs as new evidence becomes available, ensuring models adapt continuously to reflect the most current data.
If interventions succeed or fail, the probabilities behind the score update automatically. For example, a hospital may initially believe that sedatives increase the risk of falls by 30%. After six months of patient outcomes, Bayesian updating revises that probability to 40% — making the score more accurate and trustworthy over time. This dynamic updating is part of a broader family of Learning Constructs that power adaptive AI:
SGD/Backpropagation: update weights in neural networks.
Temporal Difference (TD) Learning: update expected rewards in reinforcement learning.
Bayesian Updating: update cause-and-effect probabilities with new evidence.
These mechanisms ensure that the Fall Risk Score appreciates in effectiveness as it continuously learns and becomes a more accurate decision-support tool with every use (Figure 4).
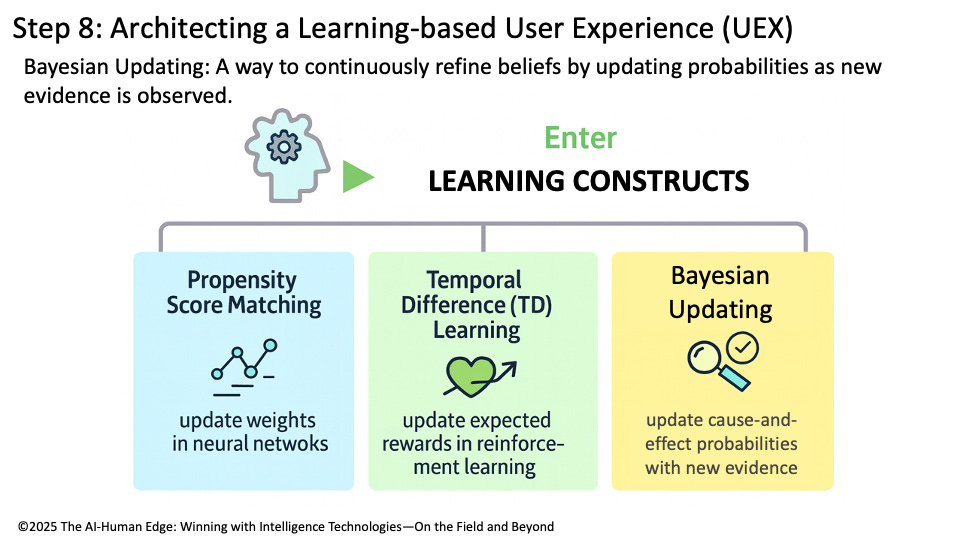
Figure 4: Step 8: Architecting a Learning-based User Experience (UEX)
💡 Causal AI Lens – Step 8
Bayesian updating makes causal scores trustworthy over time by weaving learning directly into the user experience. Each intervention, success, and failure becomes a data point that strengthens the model, ensuring the Fall Risk Score remains aligned with real-world clinical evidence and informed decisions.
Part 2 Summary: From Prediction to Causation, From Models to Assets
Predictive models can tell you what is likely to happen. Causal models reveal why it happens and allow you to test what-if interventions before applying them in the real world. When predictive and causal models are combined with continuous learning methods, such as Bayesian Updating, Backpropagation, and Temporal Difference Learning, they evolve into intelligent assets—systems that improve with every use. That’s the essence of the AI-Human Edge.
By walking through the TLADS steps, we’ve shown how subject matter experts—nurses, administrators, and family members—can shape an AI system that is causally driven, explainable in context, and adaptive to the moment. The Fall Risk Score is not just another algorithm; it is a living, appreciating intelligence asset that learns alongside the hospital staff.
Dear Bill Schmarzo, what an incredible and very technical article. I think it shows well how poor outcomes in AI projects can come not just from lack of collaboration and governance failures, but also from gaps in technical skill. This framework is powerful but not easy to put into practice. Data science is more important than ever :)