Thinking Like A Data Scientist: Attitudinal Approach

I originally wrote this blog in 2015 while working for EMC. I couldn't find the link to the original post, so I thought I’d republish it - typos and all. Sort of fun, given all the recent conversations about the dangers of correlation-based decision-making. Man, a lot has matured about Causal AI since I wrote this!!
I was reading an article in BusinessWeek titled “Kill Your Desk Chair” where the article cite the following “fact:”
A recent study, from the Pennington Biomedical Research Center in Baton Rouge, LA, followed 17,000 Canadians over 12 years and found that those who sat for most of the day were 54% more likely to die of heart attacks that those that didn’t.
Now being a person who spends a lot of time sitting behind a desk, or on an airplane, this “54% more likely to die of heart attacks” fact is very concerning. Should I throw out my current desk and buy one of those expensive “stand up and work” type of desk?
Then I started to think like a data scientist, and started to challenge the assumption that there is some sort of causation between sitting and heart attacks. Some questions that immediately popped to mind included:
Are there other variables, like lack of exercise or eating habits or age or stress of the job, which might be the cause of the heart attacks?
Was a control group used to test the validity of the study results?
Is there something about Canadians that makes them more susceptible to sitting and heart attacks?
Who sponsored this study? Maybe the manufacturer of these new expensive “stand up and work” type of desk?
One needs to be a bit skeptical when they hear these sorts of “factoids.” We should know better than to just believe these sorts of claims blindly. We’ve all heard the weatherman state that there is a 60% chance of rain on days when there isn’t a cloud in the sky (I guess the weatherman could have just flipped a coin and made as accurate a prediction). And the Governor Walker recall election in Wisconsin raised all sorts of concerns when the early exit polls predicted incorrectly the actual results of the recall vote (and caused some folks to demand a recount of the actual vote because the exit polls didn’t match the actual results).
Correlation Is Not Causality
A good data scientist knows that there is a big difference between correlation and causality. Causality is the ability to quantify cause and effect, and just because two items move in tandem, does not mean that there is causality. The relationship between the events may not even make logical sense. Here are some of my favorite examples[1]:

Figure 1: Is Facebook Driving The Greek Debt Crisis?
Do we really think that the growth in the number of active Facebook users is actually driving up the yield on the 10-year Greek government bonds? Unless joining Facebook requires all subscribers to sell their 10-year Greek government bonds, there is no causality in this correlation.

Figure 2: Is this random mountain range driving Murders in New York?
Do we really think that this mountain range is driving the murder rate in the state of New York (maybe having to climb such a mountain puts one in a more murderous state of mind)?

Figure 3: Is there causality between newspapers bought and M. Night Shyamalan movies?
Okay, this one might actually be true…
Thinking Like a Data Scientist: Having A Dubious Attitude
Thinking like a data scientist requires imagination, curiosity and a lot of skepticism to question or challenge whatever analytic insights are derived out of the data. Don’t forget that common sense makes a good yardstick to apply against any analytic results. A good data scientist tends to:
Be very clear and thorough on defining the hypothesis (and null hypothesis) they are testing; to clearly and articulately state the problem that they are trying to solve and what determines a statistically valid result.
Embrace an exploratory, discovery, visually inspective analytic process to understand, validate and cleanse the data by throwing out incomplete, inappropriate or inaccurate data, and to not let outliers skew the results.
Focus on identifying patterns and then quantifying cause-and-effect out of the data through statistical, descriptive and predictive analytics.
Grabs whatever data might be available, whether or not the data scientist is even sure that they will use that data, and worries about the data integration issues as the come up in the analytic process.
Build data enrichment processes and algorithms to create new variables and metrics that might be better predictors of performance.
Tolerant of “good enough” data to fuel “good enough” decisions (taking into account the “costs” associated with “Understanding Type I and Type II Errors”).
What Does This Mean To The Business User?
So what does this mean to you as a business user in support of your data science team?
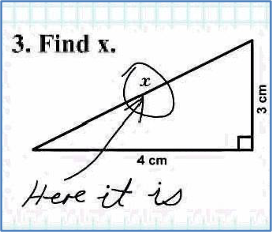
Properly set up your hypothesis and detail out your analytic plan. Be clear and precise on what you are trying to prove and the business objectives. Be as granular, transparent and thorough as possible. If you are not clear, you might end up with a “correct” answer that is actually unusable (see chart to the right[2]).
Thoroughly document your business assumptions. Allow others to review and challenge the reasonableness and validity of your assumptions. Constantly ask if the assumptions are reasonable and realistic. Don’t forget the importance of at least contemplating “black swan” events in hour model assumptions.
Plan for experimentation especially to test those model assumptions that have the biggest influence on the analytic results. Use sample groups to ensure that you are comparing apples to apples. Determine if you have failed enough (explored enough other options) before declaring victory.
Properly interpret and apply results. Apply the common sense test. Are the results reasonable and are they actionable?
In summary, don’t accept the analytic results blindly just because they come with precise-looking numbers and probabilities. Challenge the analytic results and conclusions drawn from the analytic models, especially from those who may not have the analytic credentials, experience or even the context of the business case against with the hypothesis is being tested. There have been some classic bad decisions drawn from what looked like rock-solid statistical analysis.
[1] “Correlation or Causation?” By Vali Chandrasekaran on December 01, 2011 BusinessWeek
[2] Graphic courtesy of climbingoutofthedark.blogspot.com